Module 4b: Expanding dataframes#
In this section you will learn how:
to add new rows, columns and dataframes to an existing dataframe.
There are different methods to grow your dataframes, depending on what you attach to them. Here we will explore ways to combine pandas rows, columns and entire dataframes.
import pandas as pd
import numpy as np
# load the dataframe from the previous section, method is further explained in module 4d
transposed_dict_df = pd.read_csv("transposed_dict_df-4b.csv", index_col=0)
Adding new rows and columns#
Let’s say we want to change our mind and keep the participant IDs as a standalone column, but not as row labels. Adding a new column is very straightforward - it’s like selecting a column by label and assigning values to it:
# make sure the number of entries in the new column matches the number of rows in the dataframe
transposed_dict_df["ID"] = transposed_dict_df.index
transposed_dict_df
| gender | age | height | weight | smoking | diseases | ID | |
|---|---|---|---|---|---|---|---|
| participant1 | NaN | NaN | NaN | 70.9 | False | ('Asthma', 'Diabetes') | participant1 |
| participant2 | male | 40.0 | 1.88 | 50.0 | True | () | participant2 |
| participant3 | male | 18.0 | 1.65 | 73.0 | True | ('Lung cancer',) | participant3 |
| participant4 | female | 83.0 | 1.72 | 87.0 | False | ('Cardio vascular disease', 'Alzheimers') | participant4 |
| participant5 | female | 55.0 | 1.68 | 50.0 | False | ('Asthma', 'Anxiety') | participant5 |
| participant6 | NaN | NaN | NaN | 64.0 | True | ('Diabetes',) | participant6 |
| participant7 | male | 21.0 | 1.90 | 92.9 | False | ('Asthma', 'Colon cancer') | participant7 |
| participant8 | NaN | NaN | NaN | 75.4 | False | () | participant8 |
| participant9 | female | 32.0 | 1.66 | 90.7 | True | ('Depression',) | participant9 |
| participant10 | male | 67.0 | 1.78 | 82.3 | False | ('Anxiety', 'Diabetes', 'Cardio vascular disea... | participant10 |
Same analogy applies to appending rows:
transposed_dict_df.loc["participant11"] = ["female", 34, 1.55, 64, False, (), "participant11"]
transposed_dict_df
| gender | age | height | weight | smoking | diseases | ID | |
|---|---|---|---|---|---|---|---|
| participant1 | NaN | NaN | NaN | 70.9 | False | ('Asthma', 'Diabetes') | participant1 |
| participant2 | male | 40.0 | 1.88 | 50.0 | True | () | participant2 |
| participant3 | male | 18.0 | 1.65 | 73.0 | True | ('Lung cancer',) | participant3 |
| participant4 | female | 83.0 | 1.72 | 87.0 | False | ('Cardio vascular disease', 'Alzheimers') | participant4 |
| participant5 | female | 55.0 | 1.68 | 50.0 | False | ('Asthma', 'Anxiety') | participant5 |
| participant6 | NaN | NaN | NaN | 64.0 | True | ('Diabetes',) | participant6 |
| participant7 | male | 21.0 | 1.90 | 92.9 | False | ('Asthma', 'Colon cancer') | participant7 |
| participant8 | NaN | NaN | NaN | 75.4 | False | () | participant8 |
| participant9 | female | 32.0 | 1.66 | 90.7 | True | ('Depression',) | participant9 |
| participant10 | male | 67.0 | 1.78 | 82.3 | False | ('Anxiety', 'Diabetes', 'Cardio vascular disea... | participant10 |
| participant11 | female | 34.0 | 1.55 | 64.0 | False | () | participant11 |
Since we don’t need participant information twice and it would be nice to keep 0-based indexing reference for the rows when visualising the dataframe, let’s rename rows to numbers again:
n_rows = transposed_dict_df.shape[0]
transposed_dict_df.index = np.arange(0, n_rows)
transposed_dict_df
| gender | age | height | weight | smoking | diseases | ID | |
|---|---|---|---|---|---|---|---|
| 0 | NaN | NaN | NaN | 70.9 | False | ('Asthma', 'Diabetes') | participant1 |
| 1 | male | 40.0 | 1.88 | 50.0 | True | () | participant2 |
| 2 | male | 18.0 | 1.65 | 73.0 | True | ('Lung cancer',) | participant3 |
| 3 | female | 83.0 | 1.72 | 87.0 | False | ('Cardio vascular disease', 'Alzheimers') | participant4 |
| 4 | female | 55.0 | 1.68 | 50.0 | False | ('Asthma', 'Anxiety') | participant5 |
| 5 | NaN | NaN | NaN | 64.0 | True | ('Diabetes',) | participant6 |
| 6 | male | 21.0 | 1.90 | 92.9 | False | ('Asthma', 'Colon cancer') | participant7 |
| 7 | NaN | NaN | NaN | 75.4 | False | () | participant8 |
| 8 | female | 32.0 | 1.66 | 90.7 | True | ('Depression',) | participant9 |
| 9 | male | 67.0 | 1.78 | 82.3 | False | ('Anxiety', 'Diabetes', 'Cardio vascular disea... | participant10 |
| 10 | female | 34.0 | 1.55 | 64.0 | False | () | participant11 |
Rearranging columns#
Also visually it would be more consistent to keep the ID column next to the row index at the beginning. You can rearrange all the columns again by listing all of them, but this time in your desired order:
transposed_dict_df = transposed_dict_df[['ID', 'gender', 'age', 'height', 'weight', 'smoking', 'diseases']]
transposed_dict_df
| ID | gender | age | height | weight | smoking | diseases | |
|---|---|---|---|---|---|---|---|
| 0 | participant1 | NaN | NaN | NaN | 70.9 | False | ('Asthma', 'Diabetes') |
| 1 | participant2 | male | 40.0 | 1.88 | 50.0 | True | () |
| 2 | participant3 | male | 18.0 | 1.65 | 73.0 | True | ('Lung cancer',) |
| 3 | participant4 | female | 83.0 | 1.72 | 87.0 | False | ('Cardio vascular disease', 'Alzheimers') |
| 4 | participant5 | female | 55.0 | 1.68 | 50.0 | False | ('Asthma', 'Anxiety') |
| 5 | participant6 | NaN | NaN | NaN | 64.0 | True | ('Diabetes',) |
| 6 | participant7 | male | 21.0 | 1.90 | 92.9 | False | ('Asthma', 'Colon cancer') |
| 7 | participant8 | NaN | NaN | NaN | 75.4 | False | () |
| 8 | participant9 | female | 32.0 | 1.66 | 90.7 | True | ('Depression',) |
| 9 | participant10 | male | 67.0 | 1.78 | 82.3 | False | ('Anxiety', 'Diabetes', 'Cardio vascular disea... |
| 10 | participant11 | female | 34.0 | 1.55 | 64.0 | False | () |
Joining pandas dataframes#
What if you have another dictionary/pandas dataframe with more participant data and you would like to combine them with this table? Or you would like to append another row, but you cannot call .loc anymore because your rows don’t have string labels anymore? Then consider pd.concat() or dataframe.merge() depending on your use case.
Columns#
Let’s create an example column-based additional dataset:
additional_col_df = {
       "exercise_frequency": ["low", "medium", "high", "medium", "low", "high", "medium", "low", "high", "medium", "low"],
       "alcohol_consumption": [np.nan, 0, 5, 1, 3, 0, 4, 2, 1, 0, 2]}
additional_col_df = pd.DataFrame(additional_col_df)
additional_col_df
| exercise_frequency | alcohol_consumption | |
|---|---|---|
| 0 | low | NaN |
| 1 | medium | 0.0 |
| 2 | high | 5.0 |
| 3 | medium | 1.0 |
| 4 | low | 3.0 |
| 5 | high | 0.0 |
| 6 | medium | 4.0 |
| 7 | low | 2.0 |
| 8 | high | 1.0 |
| 9 | medium | 0.0 |
| 10 | low | 2.0 |
If you simply wish to concatenate two dataframes along the columns, you can just add them in a list to pd.concat and specify the column axis:
concatenated_df = pd.concat([transposed_dict_df, additional_col_df], axis=1)
concatenated_df
| ID | gender | age | height | weight | smoking | diseases | exercise_frequency | alcohol_consumption | |
|---|---|---|---|---|---|---|---|---|---|
| 0 | participant1 | NaN | NaN | NaN | 70.9 | False | ('Asthma', 'Diabetes') | low | NaN |
| 1 | participant2 | male | 40.0 | 1.88 | 50.0 | True | () | medium | 0.0 |
| 2 | participant3 | male | 18.0 | 1.65 | 73.0 | True | ('Lung cancer',) | high | 5.0 |
| 3 | participant4 | female | 83.0 | 1.72 | 87.0 | False | ('Cardio vascular disease', 'Alzheimers') | medium | 1.0 |
| 4 | participant5 | female | 55.0 | 1.68 | 50.0 | False | ('Asthma', 'Anxiety') | low | 3.0 |
| 5 | participant6 | NaN | NaN | NaN | 64.0 | True | ('Diabetes',) | high | 0.0 |
| 6 | participant7 | male | 21.0 | 1.90 | 92.9 | False | ('Asthma', 'Colon cancer') | medium | 4.0 |
| 7 | participant8 | NaN | NaN | NaN | 75.4 | False | () | low | 2.0 |
| 8 | participant9 | female | 32.0 | 1.66 | 90.7 | True | ('Depression',) | high | 1.0 |
| 9 | participant10 | male | 67.0 | 1.78 | 82.3 | False | ('Anxiety', 'Diabetes', 'Cardio vascular disea... | medium | 0.0 |
| 10 | participant11 | female | 34.0 | 1.55 | 64.0 | False | () | low | 2.0 |
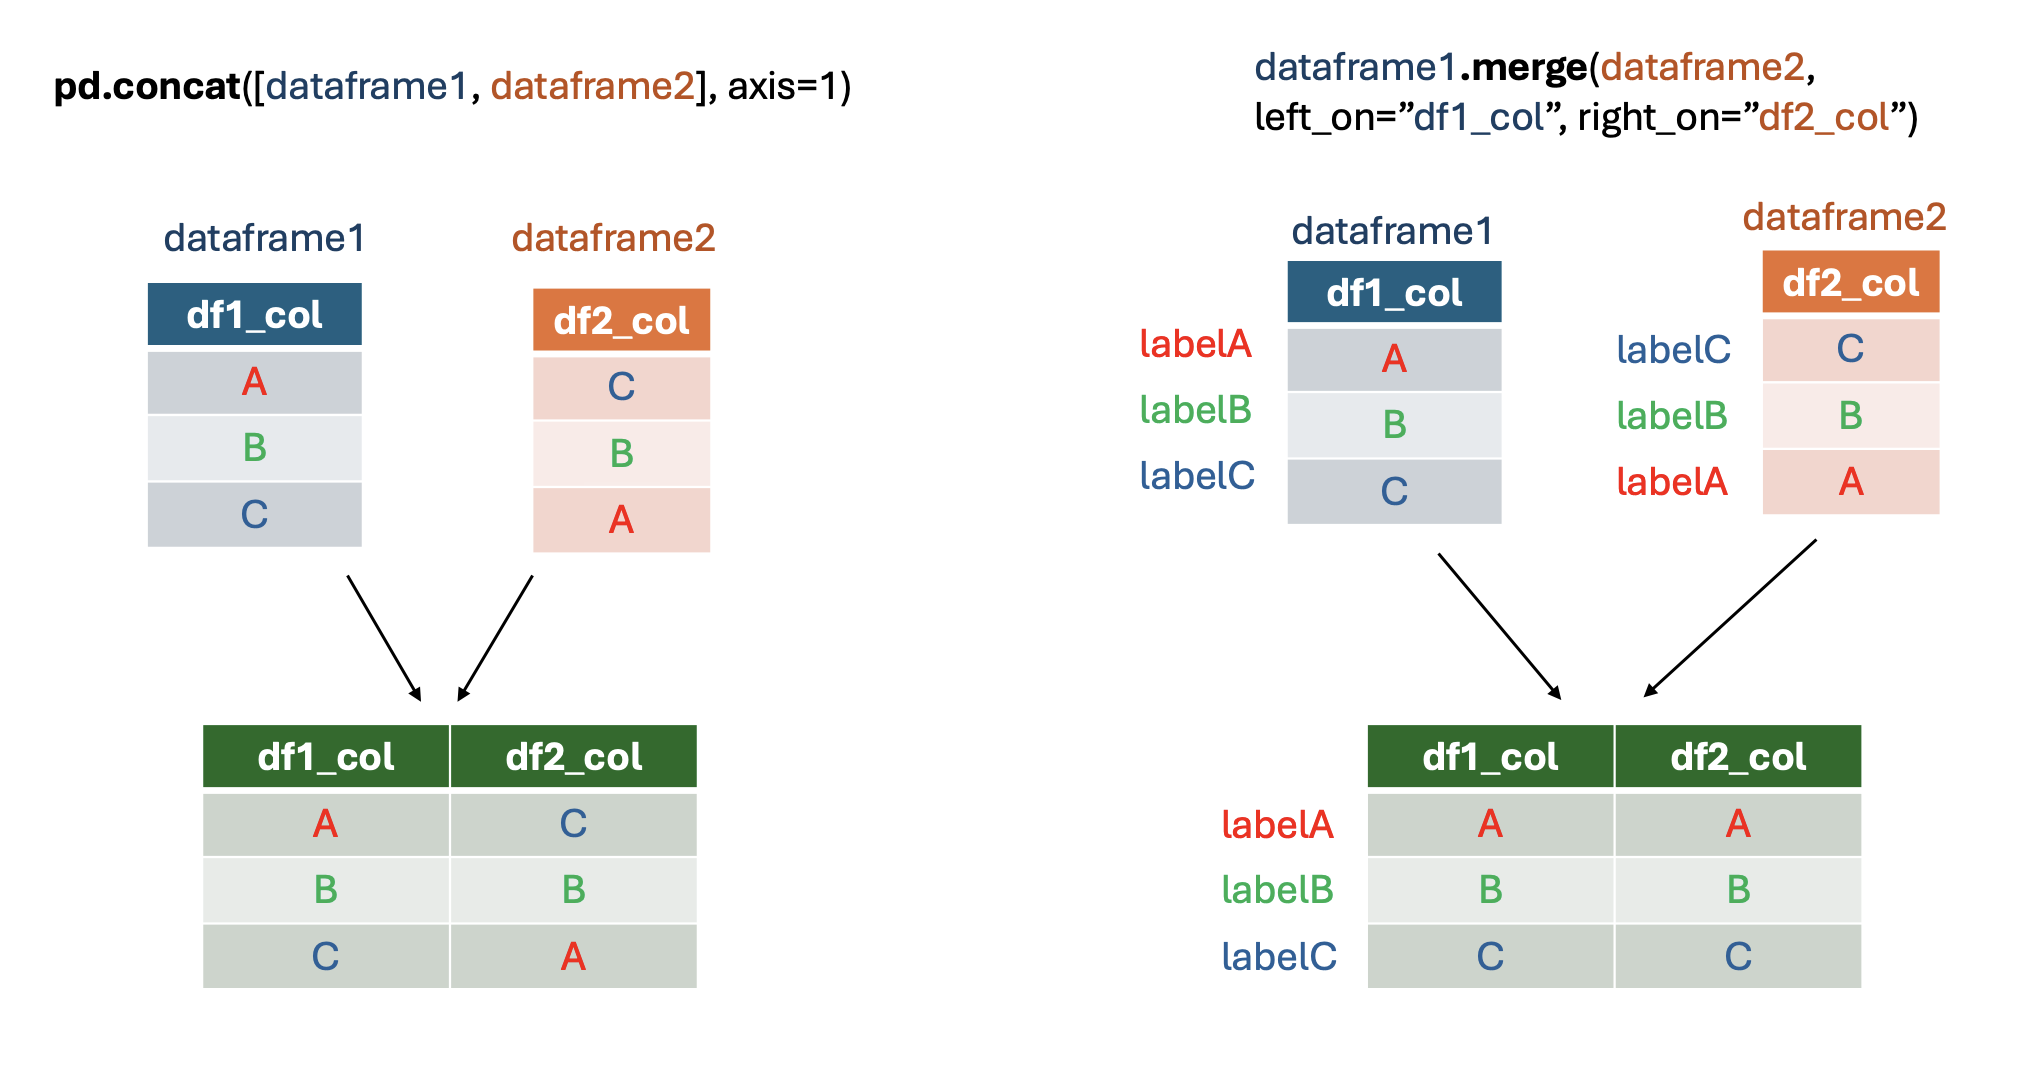
What if your additional table included participant IDs in a different order to the first table and also a different name? That’s when transposed_dict_df.merge comes in handy - it can match the rows according to the desired label. In contrast to pd.concat, this method can only be used for the column-aligned concatenation.
# adding IDs to the additional dataframe
additional_col_df["participant_name"] = ['participant6', 'participant1', 'participant2', 'participant3',
                                         'participant4', 'participant5', 'participant7', 'participant8',
                                         'participant9', 'participant10', 'participant11']
additional_col_df
| exercise_frequency | alcohol_consumption | participant_name | |
|---|---|---|---|
| 0 | low | NaN | participant6 |
| 1 | medium | 0.0 | participant1 |
| 2 | high | 5.0 | participant2 |
| 3 | medium | 1.0 | participant3 |
| 4 | low | 3.0 | participant4 |
| 5 | high | 0.0 | participant5 |
| 6 | medium | 4.0 | participant7 |
| 7 | low | 2.0 | participant8 |
| 8 | high | 1.0 | participant9 |
| 9 | medium | 0.0 | participant10 |
| 10 | low | 2.0 | participant11 |
Argument left_on refers to the column label in transposed_dict_df that we want to match with the column in additional_col_df specified in right_on:
merged_df = transposed_dict_df.merge(additional_col_df, left_on="ID", right_on="participant_name")
merged_df
| ID | gender | age | height | weight | smoking | diseases | exercise_frequency | alcohol_consumption | participant_name | |
|---|---|---|---|---|---|---|---|---|---|---|
| 0 | participant1 | NaN | NaN | NaN | 70.9 | False | ('Asthma', 'Diabetes') | medium | 0.0 | participant1 |
| 1 | participant2 | male | 40.0 | 1.88 | 50.0 | True | () | high | 5.0 | participant2 |
| 2 | participant3 | male | 18.0 | 1.65 | 73.0 | True | ('Lung cancer',) | medium | 1.0 | participant3 |
| 3 | participant4 | female | 83.0 | 1.72 | 87.0 | False | ('Cardio vascular disease', 'Alzheimers') | low | 3.0 | participant4 |
| 4 | participant5 | female | 55.0 | 1.68 | 50.0 | False | ('Asthma', 'Anxiety') | high | 0.0 | participant5 |
| 5 | participant6 | NaN | NaN | NaN | 64.0 | True | ('Diabetes',) | low | NaN | participant6 |
| 6 | participant7 | male | 21.0 | 1.90 | 92.9 | False | ('Asthma', 'Colon cancer') | medium | 4.0 | participant7 |
| 7 | participant8 | NaN | NaN | NaN | 75.4 | False | () | low | 2.0 | participant8 |
| 8 | participant9 | female | 32.0 | 1.66 | 90.7 | True | ('Depression',) | high | 1.0 | participant9 |
| 9 | participant10 | male | 67.0 | 1.78 | 82.3 | False | ('Anxiety', 'Diabetes', 'Cardio vascular disea... | medium | 0.0 | participant10 |
| 10 | participant11 | female | 34.0 | 1.55 | 64.0 | False | () | low | 2.0 | participant11 |
Here is a visual summary of the differences between pd.concat and dataframe.merge for merging dataframes by columns:
Rows#
Combining dataframes along the rows is very similar to pd.concat. Just specify the rows axis. It is also sometimes useful to include ignore_index=True to preserve continuous row numbering if you don’t keep row labels.
# creating a row-based table for the example
additional_rows_df = {"ID": ["participant17", "participant13", "participant14"], "gender": ["male", "female", "male"], "age": [70, 45, 29], "height": [1.82,  1.60, 1.75], "weight": [78.5, 62.3, 88.0], "smoking": [False, True, False], "diseases": [("Anxiety",), ("Diabetes", "Hypertension"), ()]}
additional_rows_df = pd.DataFrame(additional_rows_df)
additional_rows_df
| ID | gender | age | height | weight | smoking | diseases | |
|---|---|---|---|---|---|---|---|
| 0 | participant17 | male | 70 | 1.82 | 78.5 | False | (Anxiety,) |
| 1 | participant13 | female | 45 | 1.60 | 62.3 | True | (Diabetes, Hypertension) |
| 2 | participant14 | male | 29 | 1.75 | 88.0 | False | () |
# ignore index to have continuous rows numbering
concatenated_df = pd.concat([transposed_dict_df, additional_rows_df], axis=0, ignore_index=True)
concatenated_df
| ID | gender | age | height | weight | smoking | diseases | |
|---|---|---|---|---|---|---|---|
| 0 | participant1 | NaN | NaN | NaN | 70.9 | False | ('Asthma', 'Diabetes') |
| 1 | participant2 | male | 40.0 | 1.88 | 50.0 | True | () |
| 2 | participant3 | male | 18.0 | 1.65 | 73.0 | True | ('Lung cancer',) |
| 3 | participant4 | female | 83.0 | 1.72 | 87.0 | False | ('Cardio vascular disease', 'Alzheimers') |
| 4 | participant5 | female | 55.0 | 1.68 | 50.0 | False | ('Asthma', 'Anxiety') |
| 5 | participant6 | NaN | NaN | NaN | 64.0 | True | ('Diabetes',) |
| 6 | participant7 | male | 21.0 | 1.90 | 92.9 | False | ('Asthma', 'Colon cancer') |
| 7 | participant8 | NaN | NaN | NaN | 75.4 | False | () |
| 8 | participant9 | female | 32.0 | 1.66 | 90.7 | True | ('Depression',) |
| 9 | participant10 | male | 67.0 | 1.78 | 82.3 | False | ('Anxiety', 'Diabetes', 'Cardio vascular disea... |
| 10 | participant11 | female | 34.0 | 1.55 | 64.0 | False | () |
| 11 | participant17 | male | 70.0 | 1.82 | 78.5 | False | (Anxiety,) |
| 12 | participant13 | female | 45.0 | 1.60 | 62.3 | True | (Diabetes, Hypertension) |
| 13 | participant14 | male | 29.0 | 1.75 | 88.0 | False | () |
Save the dataframe to work on it in the next section. The method .to_csv will be explained in more detail in module 4d.
transposed_dict_df.to_csv("transposed_dict_df-4c.csv", index=False)
Here we covered the basics of merging the dataframes with pd.concat and dafaframe.merge. However they have many more functionalities, such as taking the union or intersection (join="outer"/join="inner") of column/row labels in pd.concat, which you can learn more about here.